Photovoltaic modules fail in ways that are almost perfectly visible to a thermal camera: hot spots from cracked or shaded cells, dead bypass diodes, open strings, potential-induced degradation. A utility-scale park contains hundreds of thousands of modules — far too many to walk — yet string-level inverter data can only tell you that something is wrong, never where or what.
This case looks at how an O&M contractor built a full thermal baseline of a 200 MW park from the air, and what a complete defect map was worth.
Project Background
In 2024, an O&M contractor took over a 200 MW utility-scale solar park in Northwest China — roughly 520,000 modules spread over 480 hectares of desert-steppe terrain, eight years into operation, with the original module warranty approaching its expiry. The handover audit required a full health baseline, but the previous owner had little to hand over: string-level inverter data, a stack of handheld spot-check reports, and no module-level record of any kind. The contractor proposed a complete drone thermal survey as the first act of the new contract, with quarterly re-flights folded into ongoing operations.
Pain Points of the Traditional Approach
- Inverter data is module-blind. String monitoring flags a string down 20%, but cannot say which module is responsible, or whether the cause is soiling, a failed diode, or cell damage.
- Walking surveys do not scale. Two technicians with handheld cameras cover a few thousand modules on a good day. A full park is a season of work — by the time it finishes, the first data is stale.
- Warranty claims need evidence, not anecdotes. A claim against the module supplier requires per-module, geo-referenced, dated thermal documentation. Spot checks do not add up to a claim.
- IV-curve testing samples, intrusively. It confirms that a string is sick without locating the fault, and it takes the string offline to do it.
The Thermal Imaging Solution
The survey flew autonomous lawn-mower patterns at 40 meters above ground, capturing radiometric thermal and visible pairs with geo-tags on every frame. Post-processing stitches each run, detects anomalies automatically — single-cell hot spots, multi-cell hot areas, open strings, diode patterns — classifies them by type and severity, and hands a geo-referenced defect list to the maintenance system.
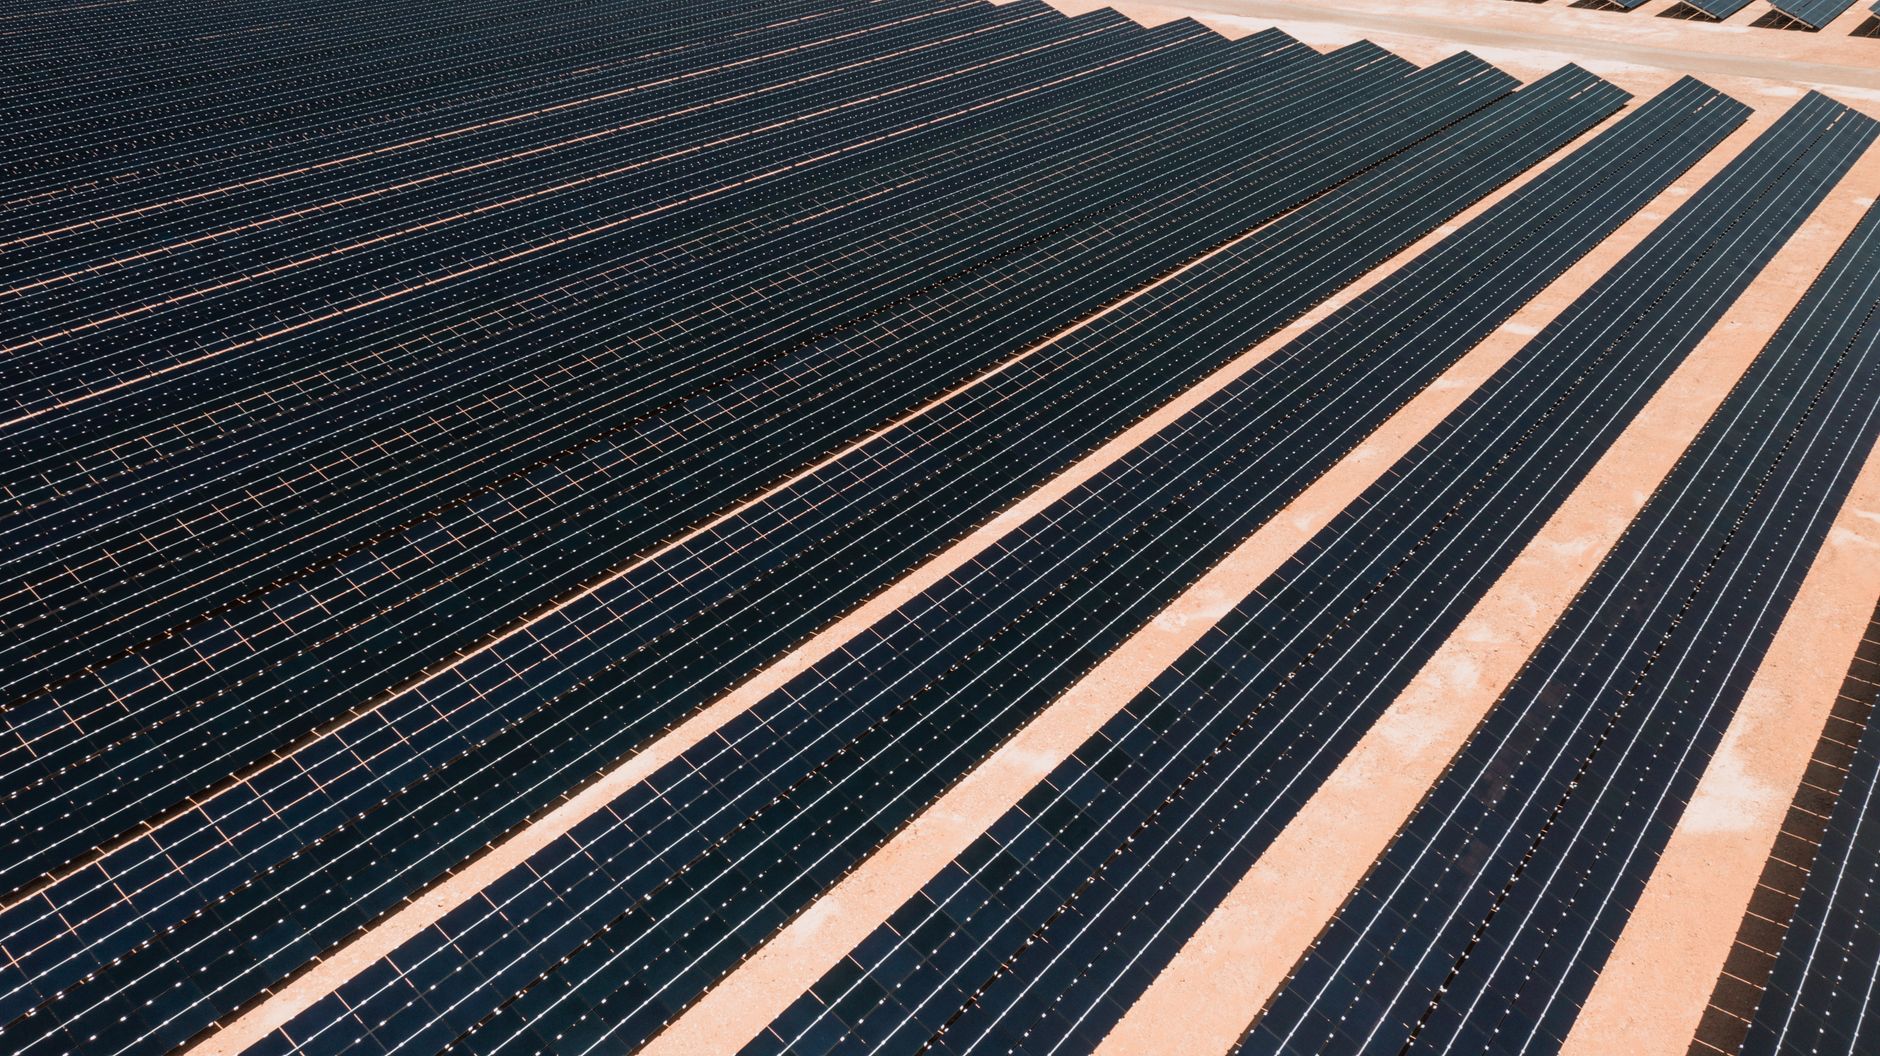
Two crews covered the entire park in eleven flying days — every module, every frame radiometric. Triage followed the data: safety-critical hot spots with a temperature rise above 20°C were repaired in the first week, string-level losses were scheduled alongside cleaning rounds, and the warranty-relevant batch was documented module by module for the supplier claim.
What the Thermal Solution Changed
- A real baseline exists. The survey found about 3,100 anomalous modules — 0.6% of the park — including 214 with safety-relevant hot spots that nobody knew about.
- Recoverable yield was quantified. The defect map pointed to roughly 1.8% of annual generation, about 6 GWh per year. The survey paid for itself inside the first quarter of recovered output.
- The warranty claim landed. Per-module thermal evidence turned a difficult conversation with the supplier into a replacement delivery — instead of the owner absorbing the loss.
- O&M became measured. Quarterly re-flights now track how defects evolve, and the cleaning schedule follows measured soiling loss rather than the calendar.
Module Selection Notes
Survey payloads need radiometric resolution per cell from 30–50 m above ground, low weight, and reliable geo-sync with the flight controller. The SPECTRA L04T 384×288 LWIR core covers standard survey heights at the lowest SWaP; the SPECTRA V19A visible core pairs naturally for the visible channel. Higher-resolution work or faster survey speeds justify the SPECTRA L06T2 640×512 core. See the solar and PV inspection application page for survey patterns.
Planning a PV survey payload or a park-wide thermal baseline? Talk to our engineers about core selection, optics, and data integration.