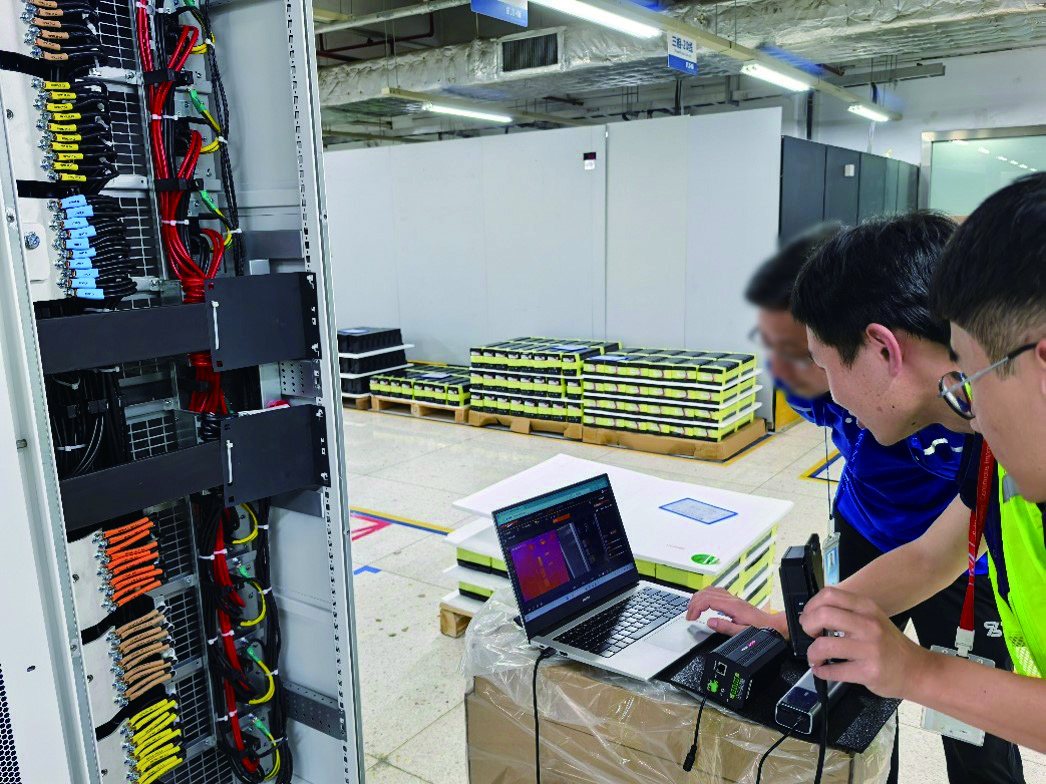
In a data center, the electrical path is the critical path. Every rack is fed through a chain of breakers, busbar joints, cable lugs and contactors — and every one of those connections is a resistor waiting to happen. A loosening lug does not announce itself; it just gets warm, then hot, then fails, usually at the worst possible load. The industry knows this, which is why data centers do infrared surveys. But a quarterly survey sees the facility four times a year. The other 361 days, the connections are on their own.
This case study looks at how one colocation data center replaced the survey calendar with continuous thermal monitoring of its distribution cabinets — and what always-on watching caught.
Project Background
In 2024, the facilities team of a colocation data center in east China — about 3,000 racks across two halls, with a 99.99% availability commitment to its tenants — reviewed its electrical maintenance regime after a near-miss. During a quarterly infrared survey, a contractor had flagged a warm breaker connection in one of the main low-voltage distribution cabinets; the follow-up found the joint already discolored. The uncomfortable question was how long it had been that way, and what the next one would look like three months after a clean survey. The electrical chain was otherwise well instrumented: meters on every feed, current and voltage trending in the building management system. What was missing was the one physical quantity that reveals a degrading connection before the current changes — temperature at the connection itself. The team approved a continuous thermal monitoring project: radiometric cameras watching the connection zones inside the main distribution cabinets, feeding alarms into the same operations console as everything else.
Pain Points of the Traditional Approach
- Quarterly surveys left 361 blind days. A connection can go from normal to failure in weeks; a survey regime bets the facility on nothing developing between visits.
- Surveys happened at whatever load the day offered. Resistance heating scales with current squared; a joint surveyed at 40% load can be a different object entirely at the evening peak.
- Opening cabinets is itself a risk. Every manual scan meant an electrician working near live busbars — an arc-flash exposure the safety team wanted reduced, not routinized.
- Metering saw current, not condition. The BMS could say how much power flowed through a breaker, but not how hot its terminals were getting while it flowed.
The Thermal Imaging Solution
The project put compact radiometric thermal cameras inside the electrical rooms, framed on the connection zones of the main distribution cabinets and busway tap-offs — the points whose failure history the team knew. Each camera streams calibrated temperature for defined measurement regions: every breaker terminal row, every busbar joint in view. The monitoring platform trends each point continuously, compares phases against each other, and raises two kinds of alarm: an absolute threshold for genuinely hot hardware, and a deviation alarm when one connection runs warmer than its siblings under the same load — the signature that catches degradation early.
Because the cameras see the cabinets continuously, the platform builds a load-versus-temperature model for every connection. A joint that runs a fixed delta above its neighbors at any load is normal hardware; a joint whose delta creeps upward week over week is a work order — long before it is an incident.
What the Thermal Solution Changed
- The 2 a.m. catch that justified the project. Eight months in, a deviation alarm flagged a busbar joint creeping upward through the night shift; the joint was re-torqued in a scheduled window. Post-repair inspection showed the contact surface already degrading — failure would have taken a row of racks down at peak.
- Live-cabinet exposure dropped sharply. Routine cabinet-open scans were eliminated; electricians now open cabinets for cause, with the thermal evidence already telling them where to look.
- Peak-load behavior became data. For the first time, the team could see every connection’s behavior at actual evening peak rather than at survey-time load — and re-prioritized two cabinets whose thermal behavior at peak had never matched their survey results.
- Tenant reporting gained a new proof point. Continuous thermal coverage of the power chain became part of the facility’s availability story in tenant audits.
Module Selection Notes
In-cabinet and electrical-room monitoring asks for a compact radiometric LWIR core with stable calibration, modest size for tight mounting positions, and a digital interface the monitoring platform consumes around the clock. The SPECTRA L06A 640×512 LWIR module is the compact core for this duty; where one camera must cover a wide cabinet line-up from a single position, the higher-resolution SPECTRA L12T 1280×1024 module fits that role. See the power inspection application page for cabinet and switchgear monitoring patterns.
Building continuous thermal monitoring for data center power infrastructure? Talk to our engineers about core selection, mounting and alarm integration.