A substation fails slowly, then all at once. A bushing that runs a few degrees warm today becomes a flashover next month; a connection that heats under load becomes an outage on the hottest afternoon of the year. The physics of these failures is thermal, and it plays out over weeks — but only if someone is watching. For a grid operator whose substations sit hours apart with nobody on site, “someone watching” used to mean a patrol car and a handheld camera once a month. Between visits, nobody was watching at all.
This case study looks at how a regional grid operator put fixed radiometric thermal cameras into its unmanned substations, and what continuous thermal watching changed.
Project Background
In 2024, a regional power grid operator in central China reviewed the inspection regime for the 23 unmanned 110 kV substations in its service territory. The stations were scattered across two prefectures — the furthest a four-hour round trip from the maintenance base. Inspection was a monthly patrol: a two-person crew drove the circuit, walked each yard with a handheld thermal camera, photographed transformers, bushings and disconnectors, and logged readings in a spreadsheet. The regime had two acknowledged weaknesses. First, coverage: a monthly snapshot catches only the defects that happen to be visible on that day, at that load. Second, timing: the patrol round took the crew a full week, so a hotspot found on day one of the round at one station meant the remaining stations waited. After a summer in which a failed surge arrester at an unmanned station caused a six-hour feeder outage — and post-failure review showed the arrester had almost certainly been running hot for weeks — the operator approved a fixed thermal monitoring pilot at five stations, later extended to all 23.
Pain Points of the Traditional Approach
- A monthly snapshot misses thermal trajectories. Connection and bushing faults develop over weeks; a single reading per month sees only one frame of that film, and the frame is often taken at light load when the defect is nearly invisible.
- Load coincidence was luck, not method. Resistance heating scales with current squared — a connection that looks fine at 9 a.m. on patrol day may be dangerously hot during the evening peak the crew never sees.
- Patrol economics scaled badly. A week of driving for two engineers covered 23 stations once; extending coverage meant more vehicles and more staff, not more insight.
- Handheld data was inconsistent. Different operators, distances and emissivity settings made month-to-month comparison unreliable — and trend analysis is where the real value of thermal data lives.
The Thermal Imaging Solution
Each station received a small set of fixed radiometric thermal cameras at engineered positions: one high-resolution unit covering the main transformer bank and bushings, and additional units framed on the disconnector line-up and cable termination areas — the specific hardware whose failure history the operator knew best. Every camera streams calibrated temperature data, not just video: the monitoring platform tracks each defined measurement region continuously, computes deltas against ambient and against sibling phases, and trends every point over weeks. Alarms are two-stage — a threshold alarm for absolute temperature, and a more sensitive deviation alarm when one phase or one connection diverges from its neighbors, which is the signature that catches faults early at partial load.
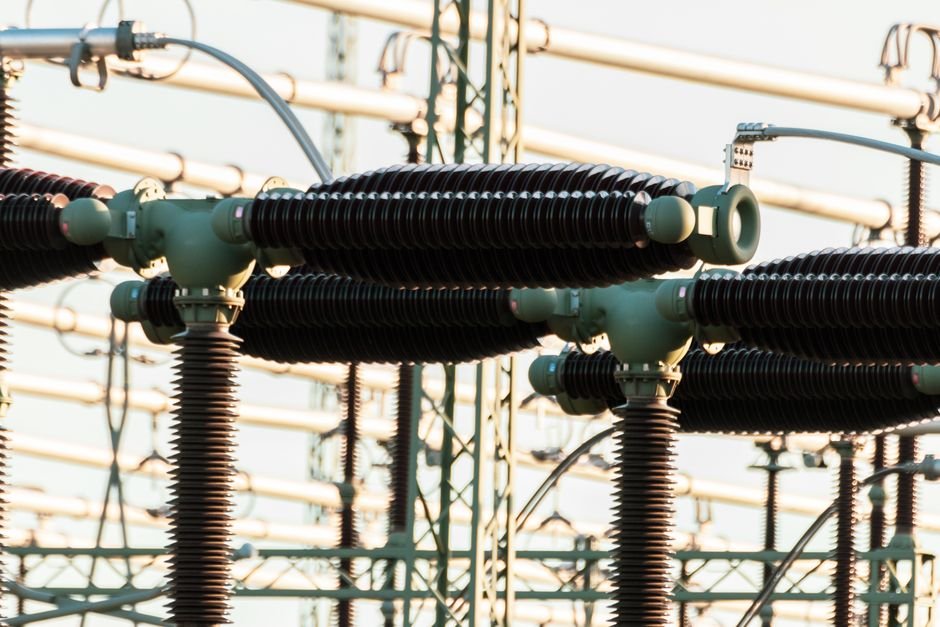
Because the cameras are fixed, every reading is taken from the same distance and angle, which makes the data comparable day over day — the foundation of genuine trending. And because the platform timestamps every frame against dispatch load data, the duty engineers can finally see how each asset behaves at peak, not just how it looked when a patrol happened to pass.
What the Thermal Solution Changed
- Faults are now caught on the trajectory, not at the incident. In the first year, the system flagged eleven developing defects across the network — including a heating bushing and two deteriorating connections — all repaired in planned outages. The operator recorded zero thermally-driven forced outages at monitored stations over the same period.
- Patrol mileage fell by two thirds. Routine thermal rounds were replaced by targeted visits triggered by data; the crews now drive to stations that need them, with the camera evidence already in hand.
- Night and peak-load behavior became visible for the first time. Several connections that had always “passed” patrol inspection turned out to run hot at evening peak — they were scheduled for rework before the summer.
- Trend data changed maintenance planning. Degradation rates, not single readings, now drive the work order queue; assets are repaired when the trajectory says so, not when the calendar does.
Module Selection Notes
Fixed substation monitoring asks for a radiometric LWIR core with stable calibration across seasons, a digital interface the monitoring platform consumes continuously, and enough resolution to cover a transformer bank from a practical mounting position. The SPECTRA L12T 1280×1024 LWIR module is the high-resolution core built for fixed monitoring duty — one unit covers a full transformer bank with per-bushing detail; the SPECTRA L06A 640×512 module covers tighter frames such as disconnector line-ups. See the power inspection application page for substation and switchyard monitoring patterns.
Building a fixed thermal monitoring system for substations or switchyards? Talk to our engineers about core selection, camera placement and platform integration.