In food processing, temperature is not a parameter — it is the product. A baked good’s texture and shelf life are set by its thermal curve through the oven; a sterilized ready meal’s safety is defined by whether every unit reached the lethal temperature for long enough. The industry’s standard tools for verifying this are contact probes: someone pulls a sample, sticks a probe in it, and trusts that the other ten thousand units behaved the same way. It is a reasonable statistical bet — until the day the oven develops a cold zone, or the retort drifts, and the bet is lost across an entire batch.
This case study looks at how one food producer moved from probe sampling to inline radiometric thermal imaging, and what measuring every unit instead of a few changed.
Project Background
In 2024, a food processing company in east China — running a high-volume bakery line and a sterilized ready-meal line in the same plant — reviewed its thermal verification regime under pressure from two directions. On the bakery line, a key retail customer had tightened its specification: core temperature at oven exit now had to be demonstrated continuously, not sampled — a requirement the probe-and-log method could not meet. On the ready-meal line, the quality team lived with a known unease: sterilization retorts were validated at installation and checked with probes per batch, but between validations, a fouled heat-exchanger or a drifting steam valve could silently shorten the thermal margin — and the first sign would be shelf-life failures in the market, weeks later. The plant approved an inline thermal imaging project: radiometric cameras at the oven exit and at the retort discharge, measuring product surface temperature on every unit, with calibration against core temperature established during validation runs.
Pain Points of the Traditional Approach
- Probe sampling measured a few units and assumed the rest. A line producing thousands of units per hour was verified by a handful of readings; cold zones between sampling points were invisible by construction.
- Contact probing destroyed the sample and the rhythm. Every probe measurement sacrificed a unit and interrupted the line’s flow — a structural limit on how much verification could ever be done.
- Oven cold zones hid between the edge sensors. Fixed oven sensors measured air temperature at the walls; a blocked airflow channel or a failing heating element could create a product cold zone the sensors never saw.
- Retort drift was found retrospectively. Between validations, the sterilization margin was faith; the feedback loop was shelf-life complaints — the most expensive possible sensor.
The Thermal Imaging Solution
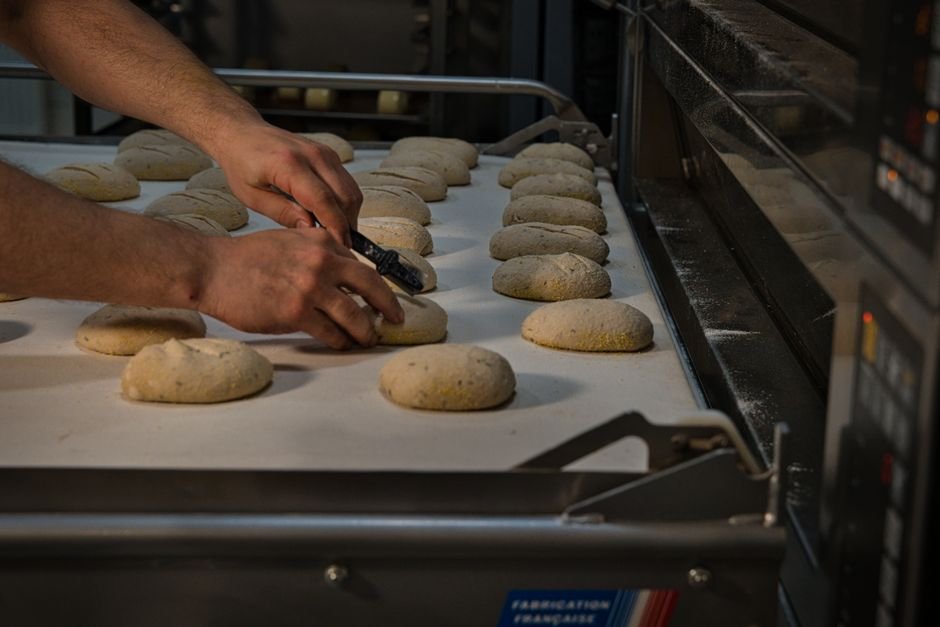
At the bakery oven exit, a radiometric thermal camera now frames the product band continuously: every unit’s surface temperature is measured as it emerges, and a surface-to-core correlation — established during validation with instrumented product — converts the reading into a verified core temperature for each unit. Units below the threshold are rejected automatically; the complete record goes to the customer’s quality portal. The same data, mapped across the width of the band, exposes the oven’s own behavior: a cold zone appears as a stripe in the thermal record long before any product fails, pointing maintenance at the exact airflow channel or element.
At the retort discharge, a second camera measures every container as it leaves the sterilizer. The discharge temperature distribution is the retort’s fingerprint: when a steam valve began drifting mid-year, the fingerprint shifted on the trend display within hours — weeks before probe checks would have caught it, and before a single compromised batch shipped.
What the Thermal Solution Changed
- Verification moved from sampling to census. Every unit now carries a verified core temperature; the retail customer’s continuous-demonstration requirement was met, and the account was renewed with the thermal record cited as the mechanism.
- Oven cold zones became maintenance tickets, not reject events. Two airflow problems and one failing element were identified from band-width thermal maps in the first year — each fixed before it produced out-of-spec product.
- The retort drift was caught in hours. The discharge fingerprint shift triggered a valve inspection the same shift; post-repair validation confirmed the margin had indeed been narrowing. The quality team estimates the catch avoided a multi-batch recall exposure.
- Probe labor went back to productive work. Routine contact probing was reduced to periodic correlation checks; the quality technicians’ time moved to analysis instead of sampling.
Module Selection Notes
Inline food-line monitoring asks for a radiometric LWIR core with stable calibration in a warm, humid environment, enough resolution to measure small product units across the band width, and a digital interface the line control system consumes in real time. The SPECTRA L12A 1280×1024 LWIR module is the high-resolution core for wide-band lines; the SPECTRA L06A 640×512 module fits narrower frames and single-lane duties. See the process monitoring application page for inline thermal verification patterns.
Building inline thermal verification for a food or beverage line? Talk to our engineers about core selection, calibration and line integration.